
Technical indicators are mathematical calculations based on historic trading activity, such as price and volume. When applied to stock charts, these indicators can help to pinpoint potential market trends and patterns, offering insights into trading decisions.
Besides, they give a numerical representation of various market aspects – momentum, trends, volatility, and market strength. For advanced day traders, gaining services of these technical indicators can significantly transform investment outcomes.
Now, let’s continue to delve deeper into some more of these key technical indicators and understand how they work.
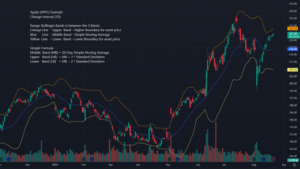
Bollinger Bands
These bands are volatility indicators that show whether a market is quiet or loud by widening or narrowing. When a market is volatile, bands widen; when it’s not, they contract. This indicator helps traders to predict sharp, short-term price movements and is particularly useful in sideways markets. Having 3 different bands (lines) as indicators. The upper band represents the upper boundary of the asset’s price, indicating potential overbought conditions. The lower band represents the lower boundary of the asset’s price, indicating potential oversold conditions. Finally the middle band is typically a 20-day Simple Moving Average, representing a baseline or trend indicator.
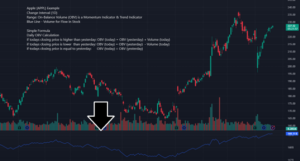
On-Balance Volume (OBV)
The OBV is a momentum indicator that uses volume flow to predict changes in stock prices. The theory is that volume precedes price. Consequently, if OBV increases while the stock price remains stable, an upward breakout is likely due to buyers accumulating. Conversely, if OBV decreases while the price remains consistent, a downward price breakout is predicted from sellers are dominating.
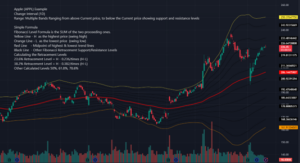
Fibonacci Retracement
Lastly, the Fibonacci Retracement, based on mathematical series, can help locate multiple support and resistance levels. In essence, it predicts where a retracement may stop, and the price may resume following the original direction. Advanced traders often use this tool alongside other indicators to validate their trades. These levels are calculated by measuring the vertical distance between a significant high and low on a price chart and then dividing that distance by the key Fibonacci ratios. Uptrend is showing possible support levels where the price might pull back to before resuming an upwards trend. Downtrend is showing possible resistance levels where the price might bounce back before continuing its downward movement.
The application of technical indicators should be strategic and defined by a clear understanding of each tool’s strengths and weaknesses to address investment returns. These tools were designed to supplement your judgment, not replace it and of course there are more indicators out there that can hit different datapoints that we did not review as well.
Hence, discernment is still paramount in any trading decision. Remember, day trading isn’t just about making rapid decisions – it’s about making the right ones. While these indicators can, without doubt, elevate your trading strategy, practicing risk management by diversifying your portfolio and setting stop losses should still be part and parcel of your greater wealth management strategy.
Technical indicators are a treasure trove of information for advanced day traders, leading to more intelligent and profitable trading decisions. By understanding the nuances of these tools and employing them judiciously, every trader can enhance their portfolio and get a winning edge in the market.
Ready to start trading? At Guardian Trading, we provide you with multiple trading platforms, real-time data, and insights. Open an account today or reach out to our team of professionals to learn how Guardian Trading can help you achieve your trading goals.